|
www.riscos.com Technical Support: |
The commands such as MOVE, DRAW, CIRCLE, etc are special cases of the more general PLOT command. This command can give a far wider range of options over what kind of shape you produce and how you produce it. Of course, the added functionality it provides makes it more complicated to use.
PLOT takes the following format:
PLOT k,x,y
where k is the mode of plotting, and x and y are the coordinates of a point to be used to position the shape. PLOT takes one pair of coordinates. To produce shapes which need more than one pair to define them, such as rectangles, it uses the previous position or positions of the graphics cursor to provide the missing information. This means that you must pay careful attention to the position of the graphics cursor after a shape has been drawn. Otherwise future plots may produce unexpected results.
Each type of plot has a block of eight numbers associated with it. These are listed below in both decimal and hexadecimal notation. (See the chapter entitled ).
| 0-7 | (&00 - &07) | Solid line including both end points |
| 8-15 | (&08 - &0F) | Solid line excluding final points |
| 16-23 | (&10 - &17) | Dotted line including both end points |
| 24-31 | (&18 - &1F) | Dotted line excluding final points |
| 32-39 | (&20 - &27) | Solid line excluding initial point |
| 40-47 | (&28 - &2F) | Solid line excluding both end points |
| 48-55 | (&30 - &37) | Dotted line excluding initial point |
| 56-63 | (&38 - &3F) | Dotted line excluding both end points |
| 64-71 | (&40 - &47) | Point plot |
| 72-79 | (&48 - &4F) | Horizontal line fill (left & right) to non-background |
| 80-87 | (&50 - &57) | Triangle fill |
| 88-95 | (&58 - &5F) | Horizontal line fill (right only) to background |
| 96-103 | (&60 - &67) | Rectangle fill |
| 104-111 | (&68 - &6F) | Horizontal line fill (left & right) to foreground |
| 112-119 | (&70 - &77) | Parallelogram fill |
| 120-127 | (&78 - &7F) | Horizontal line fill (right only) to non-foreground |
| 128-135 | (&80 - &87) | Flood to non-background |
| 136-143 | (&88 - &8F) | Flood to foreground |
| 144-151 | (&90 - &97) | Circle outline |
| 152-159 | (&98 - &9F) | Circle fill |
| 160-167 | (&A0 - &A7) | Circular arc |
| 168-175 | (&A8 - &AF) | Segment |
| 176-183 | (&B0 - &B7) | Sector |
| 184-191 | (&B8 - &BF) | Block copy/move |
| 192-199 | (&C0 - &C7) | Ellipse outline |
| 200-207 | (&C8 - &CF) | Ellipse fill |
| 208-215 | (&D0 - &D7) | Graphics characters |
| 216-223 | (&D8 - &DF) | Reserved for Acorn expansion |
| 224-231 | (&E0 - &E7) | Reserved for Acorn expansion |
| 232-239 | (&E8 - &EF) | Sprite plot |
| 240-247 | (&F0 - &F7) | Reserved for user programs |
| 248-255 | (&F8 - &FF) | Reserved for user programs |
Within each block of eight, the offset from the base number has the following meaning:
| offset | meaning |
|---|---|
| 0 | move cursor relative (to last graphics point visited) |
| 1 | plot relative using current foreground colour |
| 2 | plot relative using logical inverse colour |
| 3 | plot relative using current background colour |
| 4 | move cursor absolute (i.e. move to actual coordinate given) |
| 5 | plot absolute using current foreground colour |
| 6 | plot absolute using logical inverse colour |
| 7 | plot absolute using current background colour |
PLOT is a good example of where using hexadecimal notation helps to make things clearer. Each block of eight starts at either &x0 or &x8, where x represents any hexadecimal digit, so a plot absolute in the current foreground colour, for example, has a plot code of &x5 or &xD. Thus, it is obvious which mode of plotting is being used. Similarly, it is obvious which shape is being plotted, and so, for example, if the plot is between &90 and &9F, then it is a circle. This is a far easier range to recognise than 144 to 159.
Each of the types of plot is described in further detail below.
A line is plotted between the coordinates given by the PLOT and the previous position of the graphics cursor. The following examples draw a line from (200,200) to (800,800):
10 MODE 0
20 PLOT &04,200,200
30 PLOT &05,800,800
These two PLOT statements are equivalent to MOVE 200,200 and DRAW 800,800 respectively.
The same line can be drawn by a different PLOT code:
10 MODE 0
20 PLOT &04,200,200
30 PLOT &01,600,600
This demonstrates the use of relative plotting. The coordinate (600,600) which has been given in line 30 is relative to the position of the graphics cursor. The absolute value is obtained by adding this offset to the previous position i.e. (600,600) + (200,200) which gives a position of (800,800). This is equivalent to DRAW BY 600,600.
Straight lines do not have to be drawn as a solid line. Instead you can set up a pattern of dots and dashes and use that to determine which pixels along the line will be plotted.
A dot-dash pattern is set up using:
VDU 23,6,n1,n2,n3,n4,n5,n6,n7,n8
where n1 to n8 define a bit pattern. Each bit which is set to one represents a point plotted and each bit set to zero represents no point. The pattern starts at bit 7 of n1, then for each pixel plotted moves one bit to the right in n1. After bit 0 of n1 has been used, bit 7 of n2 is used, and so on.
The pattern can be made to repeat (i.e. go back to bit 7 of n1) after a given number of pixels. The maximum pattern repeat is 64. However, you can set up any repeat between one and 64 using:
*FX 163,242,n
If you set n to zero, this sets up the default pattern which has a repeat length of eight bits and is alternately on and off, i.e. n1 is %10101010 (&AA).
There are four different methods which may be used to plot the line:
| PLOT range | Effect |
|---|---|
| &10-&17 | Both end points included, the pattern being restarted when each new line is drawn. |
| &18-&1F | Final point omitted, the pattern being restarted when each new line is drawn. |
| &30-&37 | Initial point omitted, the pattern being continued when each new line is drawn. |
| &38-&3F | Both end points omitted, the pattern being continued when each new line is drawn. |
To draw a triangle plot, you need the coordinates given with the triangle PLOT code and two previous points which mark the other corners. For example:
10 MODE 12
20 MOVE 200,200
30 MOVE 600,200
40 PLOT &55,400,400
This plots a triangle with corners (200,200), (600,600) and (400,400).
Adding a further line:
50 PLOT &55,800,400
plots a further triangle using corners (600,200), (400,400) and (800,400).
An axes-aligned (filled) rectangle plot can be plotted between the coordinates given by the PLOT and the previous position of the graphics cursor. For example:
MOVE 200,200
PLOT &61,600,600
This is equivalent to RECTANGLE FILL 200,200, 600,600. You can also specify absolute coordinates in the PLOT version, for example:
MOVE 200,200
PLOT &65, 800,800
A parallelogram plot is constructed as a rectangle which has been sheered sideways. For example:
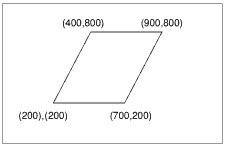
These require three points to define them. Thus to plot the parallelogram shown above the following could be used:
MOVE 200,200
MOVE 700,200
PLOT &75,900,800
Although any three corners of the parallelogram may be used to define it, the order in which these are given affects which way round the parallelogram appears. Consider the three points given below:
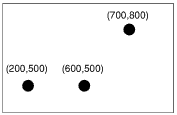
These could produce any of three parallelograms, depending on the order in which they were used. The rule to determine what the final parallelogram will look like is as follows: the three points specify adjacent vertices, with the fourth vertex being calculated from these. From this, it can be seen that the unspecified corner is the one which appears diagonally opposite the second point given.
Suppose, for example, you used the following sequence of statements with the three points shown above:
MOVE 200,500
MOVE 600,500
PLOT &75,700,800
The final point is calculated by the computer to have the coordinates (300,800), diagonally opposite the point (600,500).
The other two possible parallelograms that would be obtained using these three sequences are:
MOVE 600,500 : MOVE 700,800 : PLOT &75,200,500
MOVE 700,800 : MOVE 200,500 : PLOT &75,600,500
When specifying the corners, you can give them in 'clockwise' or 'anti-clockwise' order; the same shape is drawn regardless.
To plot a circle, define the centre by moving to it, and then use PLOT with the relevant plot code and the coordinates of a point on its circumference. For example, to plot a solid circle in the centre of the screen with a radius of 100, type
MOVE 640,512 :REM centre
PLOT &9D,740,512 :REM Xcentre+radius,Ycentre
Alternatively you could use relative plotting:
MOVE 640,512 :REM centre
PLOT &99,100,0 :REM radius,0
In both these examples the circles are solid and could have been produced using the CIRCLE FILL command. The equivalent of the CIRCLE command for producing outlines of circles would be PLOT &95 and PLOT &91.
Ellipses are more complicated to define than circles:
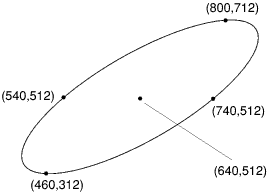
To plot the above ellipse, the following information is required:
For example, to draw the ellipse above, you could use:
MOVE 640,512 :REM the centre
MOVE 740,512 :REM the righthand point
PLOT &C5,800,712 :REM the top point
or alternatively:
MOVE 640,512 :REM the centre
MOVE 540,512 :REM the lefthand point
PLOT &C5,480,312 :REM the bottom point
Note that only the x coordinate of the second point is relevant, although for clarity it is good practice to give the same y coordinate as for the centre point.
The following example creates a pattern using a number of differently shaped ellipses:
10 MODE 0
20 FOR step% = 0 TO 400 STEP 25
30 MOVE 640,512
40 MOVE 215+step%,512
50 PLOT &C5,640,512+step%
Solid ellipses are drawn in the same way using the plot codes &C8 to &CF.
The BASIC ELLIPSE keyword provides an easier way of specifying rotated ellipses.
We saw above how circle outlines are defined and drawn. In a similar way, just a portion of the circle outline may be drawn to produce an arc. In this case, three points are required: the centre of the circle and two points to indicate the starting and finishing points of the arc. Ideally, these would be given as follows:
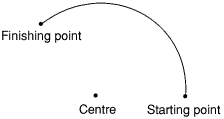
In the example above, however, both the starting and finishing points are on the arc itself. This is a design which requires a large amount of calculation. It is easier for the starting point to be taken as being on the arc and used to calculate the radius, the finishing point being used just to indicate the angle the arc subtends. For example:
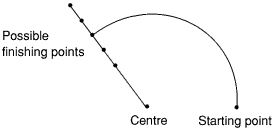
This is the method used by the VDU drivers. To draw an arc, you need to specify the centre of the circle it is based upon and the starting point of the arc, and then to plot to a third point to specify the angle.
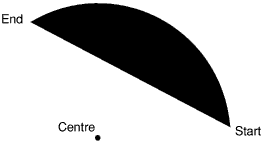
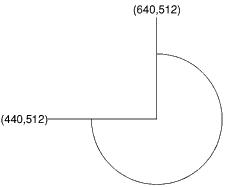
The example below draws an arc based on a circle whose centre is at (640,512). It draws the portion of the arc from 0 to 270. Since arcs are drawn anticlockwise this means that its starting position is the point (440,512) (270) and its finishing position (640,512+n) (0):
MOVE 640,512
MOVE 440,512
PLOT &A5,640,1000
The resulting arc would look like that drawn below:
A sector is a filled shape enclosed by two straight radii and the arc of a circle.
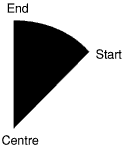
Sectors are defined in a similar manner to arcs. For example:
MOVE 640,512 :REM centre point
MOVE 440,512 :REM starting point on the circumference
PLOT &B5,640,1000 :REM point indicating angle of sector
Again the sector is taken as going anti-clockwise from the starting point to the finishing point.